SRTM 90m Digital Elevation Database
The SRTM digital elevation data, originally produced by NASA, is a major breakthrough in digital mapping of the world, and provides a major advance in the accessibility of high quality elevation data for large portions of the tropics and other areas of the developing world. The SRTM digital elevation data provided on this site has been processed to fill data voids, and to facilitate its ease of use by a wide group of potential users. This data is provided in an effort to promote the use of geospatial science and applications for sustainable development and resource conservation in the developing world.
Digital elevation models (DEM) for the entire globe, covering all of the countries of the world, are available for download on this site. The SRTM 90m DEM’s have a resolution of 90m at the equator, and are provided in mosaiced 5 deg x 5 deg tiles for easy download and use. All are produced from a seamless dataset to allow easy mosaicing. These are available in both ArcInfo ASCII and GeoTiff format to facilitate their ease of use in a variety of image processing and GIS applications. Data can be downloaded using a browser or accessed directly from the ftp site. If you find this digital elevation data useful, please let us know at csi@cgiar.org.
Read more
The NASA Shuttle Radar Topographic Mission (SRTM) has provided digital elevation data (DEMs) for over 80% of the globe. This data is currently distributed free of charge by USGS and is available for download from the National Map Seamless Data Distribution System, or the USGS ftp site. The SRTM data is available as 3 arc second (approx. 90m resolution) DEMs. A 1 arc second data product was also produced, but is not available for all countries. The vertical error of the DEM’s is reported to be less than 16m. The data currently being distributed by NASA/USGS (finished product) contains “no-data” holes where water or heavy shadow prevented the quantification of elevation. These are generally small holes, which nevertheless render the data less useful, especially in fields of hydrological modeling.
Dr. Andy Jarvis and Edward Guevara of the CIAT Agroecosystems Resilience project, Dr. Hannes Isaak Reuter (JRC-IES-LMNH) and Dr. Andy Nelson (JRC-IES-GEM) have further processed the original DEMs to fill in these no-data voids. This involved the production of vector contours and points, and the re-interpolation of these derived contours back into a raster DEM. These interpolated DEM values are then used to fill in the original no-data holes within the SRTM data. These processes were implemented using Arc/Info and an AML script. The DEM files have been mosaiced into a seamless near-global coverage (up to 60 degrees north and south), and are available for download as 5 degree x 5 degree tiles, in geographic coordinate system – WGS84 datum. These files are available for download in both Arc-Info ASCII format, and as GeoTiff, for easy use in most GIS and Remote Sensing software appications. In addition, a binary Data Mask file is available for download, allowing users to identify the areas within each DEM which has been interpolated.
MIRROR DOWNLOAD SITE: Dr. Mark Mulligan (King’s College London) mirrors the data, and has created a Google Earth Interface for browsing and downloading SRTM tiles. it also provides smaller (1 by 1 degree) tiles for users who have difficulty with the 5×5 degree tiles as well as 2D and 3D visualisation of the data.
Google Link: http://www.ambiotek.com/topoview
Download SRTM KML file click here
Download Google-Earth click here
The CGIAR-CSI has produced this website under the guidance of Dr. Robert Zomer, and the support of the International Water Management Institute (IWMI). Database search, data display, and download programming was implemented by GENESIIS Software. Many thanks to CGNET for hosting the database and tech support.
Funding for this project has been provided by the CGIAR ICT-KM Program: ICT for Tomorrow’s Science Initiative.
COMING SOON: VERSION 5
The SRTM data available here is version 4. It was last updated in November 2018. Version 5 is planned for 2019.
![]()
Download SRTM Data
Frequently Asked Questions (FAQ)
What is the source of this data, and why is it different from the NASA data?
The current dataset (Version 4) has been produced based on the finished-grade 3 arc-second SRTM data released by NASA and distributed by the USGS through ftp access (ftp://edcsgs9.cr.usgs.gov/pub/data/srtm/version1/). The original data came with data voids, where insufficient contrast was available in the radar data to extract the elevation. These data voids tend to occur over water bodies (lakes and rivers), areas with snow cover and in mountainous regions (for example, the Himalayas has the greatest concentration of no data voids in the original data). The CGIAR-CSI SRTM dataset has undergone post-processing of the NASA data to “fill in” the no data voids through interpolation techniques (see the Data Processing and Methodology page for detailed description). The result is seamless, complete coverage of elevation for the globe.
What formats are available?
The data comes in two formats: arc-formatted ASCII and GeoTIFF.
Arc ASCII: This is a text-based data array, with a five-line header providing the information on spatial extent and resolution.The coordinates in the header represent the lower left corner of the lower left pixel. No data values are represented by values of –9999.
This data can be imported into ArcView 3.2 through use of the Spatial Analysis extension and File->Import Data Source.
Within ArcGIS, there are different methods available for importing ASCII files. You can access toolboxes from the ArcToolbox window or the ArcCatalog tree. The Conversion toolbox contains tools that convert data between various formats. Select Ascii to raster. Next a dialog box appears where you supply the parameter values for the tool, then click OK. Alternatively, the command line syntax is:
ASCIIToRaster_conversion {INTEGER | FLOAT}
Many other GIS software can read ARC ASCIIs through import functions.
GeoTIFF: The GeoTiff data are georeferenced images (with the geographic data embedded – there is no .gtif file) in signed 16 bit (-32768 to 32767) TIF format. They have been produced through export from ArcGIS 8. In the GeoTIFF files, values of –32768 represent no data regions.
When I import GeoTIFF data, values of –32768 appear. What does this mean?
When the GeoTiff files are imported into some software programs, it has been reported that values of –32768 result. This is due to the software failing to identify values of –32768 as pixels with no data. Users can either search for a solution that fixes this or should explore the ASCII files that so far have not presented any similar problems.
This problem can be solved by reclassifying (reclassifying –32768 as NO DATA) or querying all pixels with values greater than –32768, and recalculating the grid based only on those regions. One command in Arc/Info can also solve this (the user should specify the name of the grid for “outgrid” and “srtmdem”)::
OUTGRID = setnull(SRTMDEM == -32768, SRTMDEM)
Why do some mountain regions have peaks significantly lower than they should be?
As mentioned earlier, many original data voids are concentrated in mountainous areas and in snow-covered regions. Hence, many peaks in high-mountain areas are actually interpolated. Without using a high resolution co-variable for the interpolation, the interpolation fails to identify that the data void is actually a peak, and tends to “flatten” the peak, leading to underestimates in the true elevation for that region. This issue is largely resolved in Version 4.
Why do some small islands not appear in the dataset?
The dataset available online has been cut for shorelines using the Shorelines and Water Bodies dataset (SWBD) that accompanies SRTM topography data. In some cases this dataset fails to include small islands. The result is that these small islands, originally captured in the SRTM data, are lost from the dataset during the cutting process with shorelines. Uncut data is available upon request – this includes large areas of radar backscatter over water bodies.
Why do some regions have very smooth looking topography?
Interpolated regions in the dataset can often be spotted as they appear to be very smooth, visibly lacking low-scale detail. These are the areas with original no data voids, that have undergone interpolation.
When is the next update likely to be available, and what modifications are expected?
The current release is Version 4. It is envisaged that CGIAR-CSI SRTM Version 4 is our definitive and final release of the 3-arc-second product. However, we do plan some improvements which will be updated as patches. These will include areas where new high-resolution DEMs become available for the interpolation of holes. This may include the use of ASTER scenes to fill holes.
Can I use this data for commercial use?
f interested in using this data for commercial purposes please email Andy Jarvis.
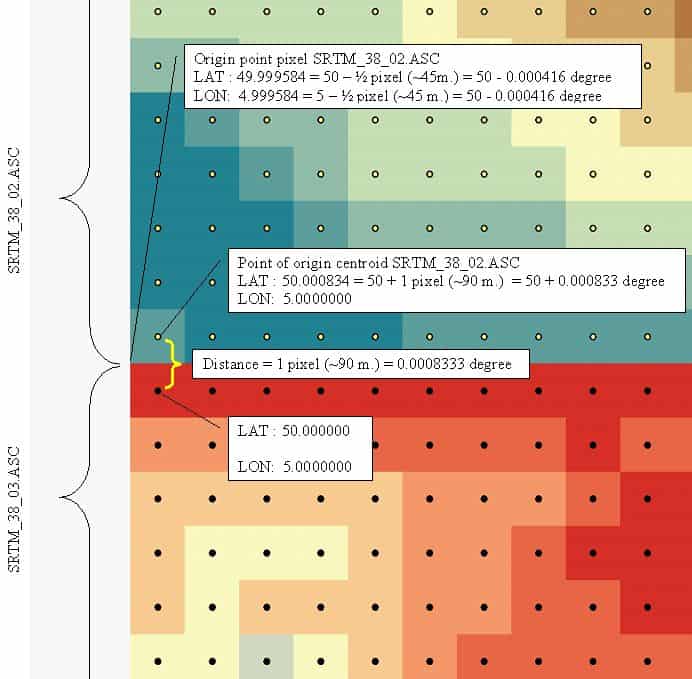
What is the point of origin and placement of a pixel in the dataset?
The below diagram shows how an example SRTM tile should be read. This is an example for SRTM_38_03 and SRTM_38_02.
Disclaimer
Processed SRTM Data
The data distributed here are in ARC GRID, ARC ASCII and Geotiff format, in decimal degrees and datum WGS84. They are derived from the USGS/NASA SRTM data.
CIAT have processed this data to provide seamless continuous topography surfaces. Areas with regions of no data in the original SRTM data have been filled using interpolation methods described by Reuter et al. (2007).
Distribution
Users are prohibited from any commercial, non-free resale, or redistribution without explicit written permission from CIAT. Users should acknowledge CIAT as the source used in the creation of any reports, publications, new data sets, derived products, or services resulting from the use of this data set. CIAT also request reprints of any publications and notification of any redistributing efforts. For commercial access to the data, send requests to Andy Jarvis.
No warranty or liability
CIAT provides these data without any warranty of any kind whatsoever, either express or implied, including warranties of merchantability and fitness for a particular purpose. CIAT shall not be liable for incidental, consequential, or special damages arising out of the use of any data.
Citation
We kindly ask any users to cite this data in any published material produced using this data, and if possible link web pages to the SRTM page (http://srtm.csi.cgiar.org).
Citations should be made as follows: Jarvis A., H.I. Reuter, A. Nelson, E. Guevara, 2008, Hole-filled seamless SRTM data V4, International Centre for Tropical Agriculture (CIAT), available from http://srtm.csi.cgiar.org.
References
Reuter H.I, A. Nelson, A. Jarvis, 2007, An evaluation of void filling interpolation methods for SRTM data, International Journal of Geographic Information Science, 21:9, 983-1008.
Contact us
Andy Jarvis, Ph.D.
Research Area Director – Decision and Policy Analysis
International Centre for Tropical Agriculture (CIAT)
Email: a.jarvis@cgiar.org
Edward Guevara
Research Associate – Decision and Policy Analysis Research Area
International Centre for Tropical Agriculture (CIAT)
Email: e.d.guevara@cgiar.org