Mapping Spatial Variation in Fertilizer Prices
A new study jointly developed by UC Davis (Camila Bonilla Cedrez and Robert Hijmans), CIMMYT (Jordan Chamberlain), and IFPRI (Zhe Guo) focused on the spatial discrepancies in fertilizer prices. The study compiled local market urea price in eighteen countries in sub-Saharan Africa for the period between 2010-2018 and used spatial interpolation models—using points with known values to approximate values at other unknown points — to predict local prices at locations for which no empirical data was available.
The authors note that this is the first major attempt to systematically describe the spatial variability of fertilizer prices within the target countries and test the ability to estimate the price at unsampled locations.
Abstract
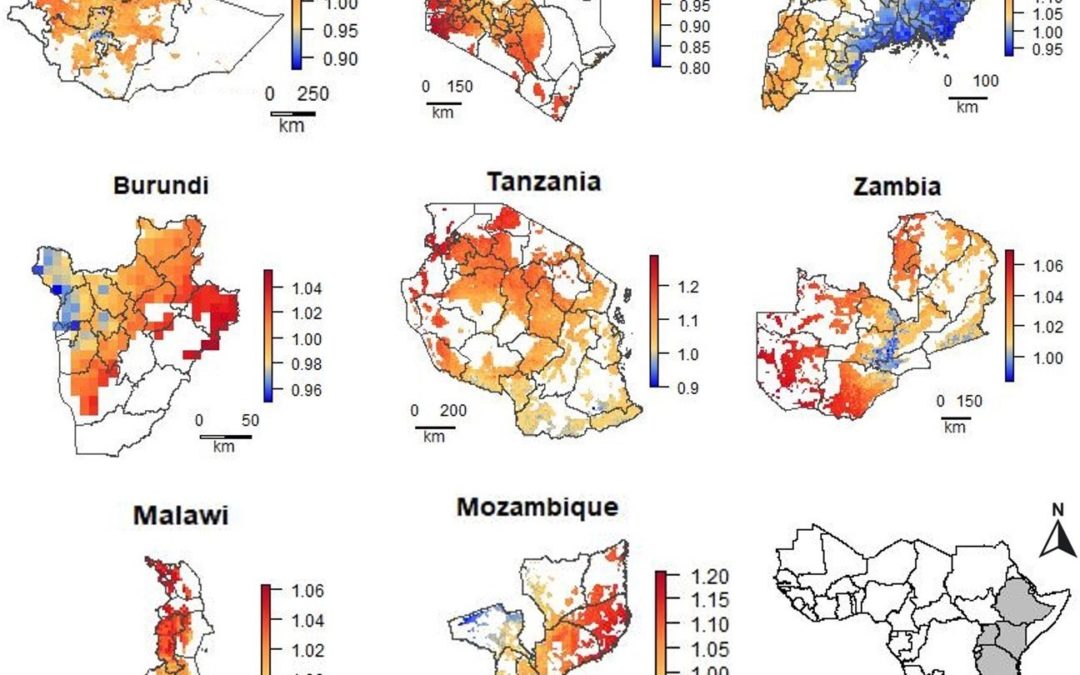
Low crop yields in Sub-Saharan Africa are associated with low fertilizer use. To better understand patterns of, and opportunities for, fertilizer use, location specific fertilizer price data may be relevant. We compiled local market price data for urea fertilizer, a source of inorganic nitrogen, in 1729 locations in eighteen countries in two regions (West and East Africa) from 2010–2018 to understand patterns in the spatial variation in fertilizer prices. The average national price was lowest in Ghana (0.80 USD kg-1), Kenya (0.97 USD kg-1), and Nigeria (0.99 USD kg-1). Urea was most expensive in three landlocked countries (Burundi: 1.51, Uganda: 1.49, and Burkina Faso: 1.49 USD kg-1). Our study uncovers considerable spatial variation in fertilizer prices within African countries. We show that in many countries this variation can be predicted for unsampled locations by fitting models of prices as a function of longitude, latitude, and additional predictor variables that capture aspects of market access, demand and environmental conditions. Predicted within-country urea price variation (as a fraction of the median price) was particularly high in Kenya (0.77–1.12), Nigeria (0.83–1.34), Senegal (0.73–1.40), Tanzania (0.90–1.29) and Uganda (0.93–1.30), but much lower in Burkina Faso (0.96–1.04), Burundi (0.95–1.05), and Togo (0.94–1.05). The correlation coefficient of the country level models was between 0.17 to 0.83 (mean 0.52) and the RMSE varies from 0.005 to 0.188 (mean 0.095). In 10 countries, predictions were at least 25% better than a null-model that assumes no spatial variation. Our work indicates new opportunities for incorporating spatial variation in prices into efforts to understand the profitability of agricultural technologies across rural areas in Sub-Saharan Africa.
Bonilla Cedrez C, Chamberlin J, Guo Z, Hijmans RJ (2020) Spatial variation in fertilizer prices in Sub-Saharan Africa. PLoS ONE 15(1): e0227764.
January 21, 2020
CGIAR-CSI