Rapid Response Analytics of COVID-19 Impact on Agriculture and Environment
Authors:
Chandrashekhar Biradar (ICARDA)
Principal Scientist (Agroecosystems), Head of Geoinformatics Unit
Gopal Krishna (ICARDA)
Geospatial Research Specialist, Geoinformatics Unit
The COVID-19 global pandemic resulted in precautionary measures in several countries that inevitably affected agri-food systems, its allied industries and livelihoods of workers and communities alike. Initially, there were no available data to accurately assess COVID-19 impact on the agricultural sector, livelihoods and environment. While country-wide lockdowns were necessary measures, they brought the agricultural sector to an abrupt standstill at a time when crops were at their peak maturity stage and in some cases ready for harvesting. This could have serious repercussions on the food supply chains, and impact the next planting season. A monitoring solution needed to be found to monitor delays in harvesting that could result in production loss and impact on grain quality, and gather other important factors to help decision making during these unprecedented circumstances.

A team of ICARDA scientists immediately began developing a rapid assessment tool using Earth Observation images and big data analytics in the cloud computing domain. The crop monitoring tool was piloted in India, which undergoes the largest lockdown in the world and where a majority of the population depends on agriculture for its livelihood and economy.
The near-real-time remote sensing analytics of Google Earth Engine provide rapid results to show comparative analytics of monitored crop harvesting progression, the dynamics of cropping systems in terms of active cropped area, crop fallows, length of fallow, and impact on air pollution. This Rapid Response Tool helps visualize results at the fractal level and provides quantitative information at the country, state, and district level that can be easily compared with previous years. The tool allows scientists and policymakers to obtain rapid analytical information at various levels and granularity and can be further refined to serve as a location-based decision support system at tehsils to district-level intervention. The tool categorizes its display into the following functions:
Monitoring Harvest Progression
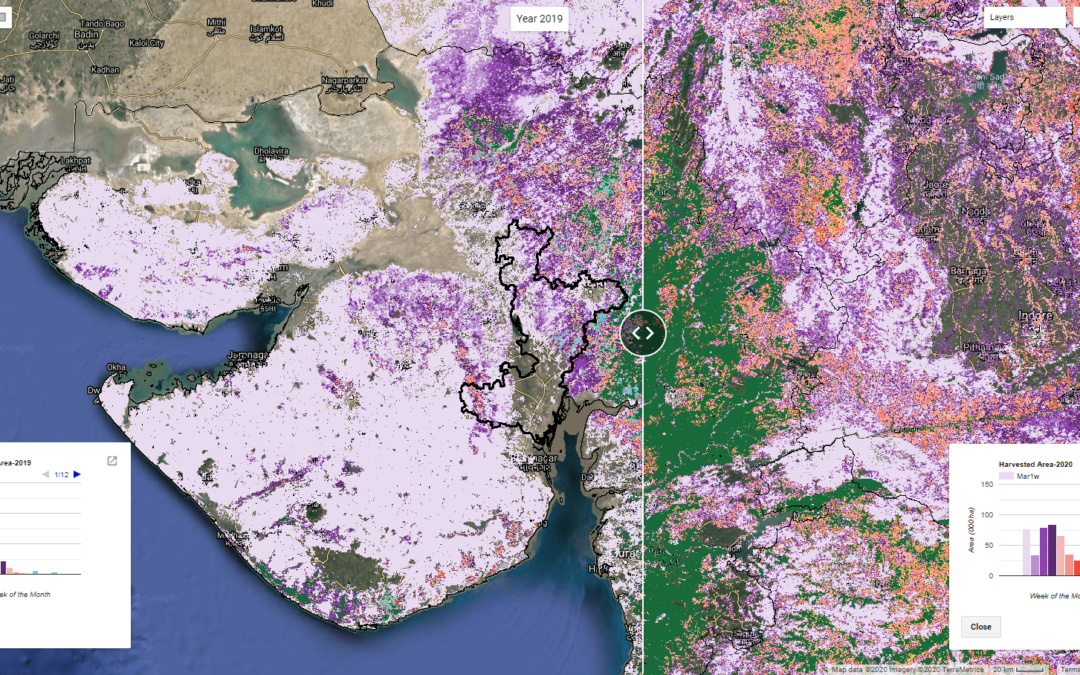
Providing comparative crop harvesting progression at the country, state, and district levels. It shows weekly progress of harvesting, starting from March to May for 2019 and March to April for 2020, with harvesting area (000’ Ha) for each week. Due to the 2020 lockdown, there is at least a one-week delay in crop harvest in the Indo-Gangetic Plains and adjoining districts, which are major wheat-growing districts. The image below provides visual analytical of the spatial distribution, hotspots, and also some quantitative weekly results. All data can be compared with previous years’.
Crop-Fallows Dynamics
After harvesting of major rabi season crops, farmers tend to leave their fields as fallow till the sowing of next season’s crop. The next sowing usually takes place 2-3 months later. This tool can help the user or policymaker visualize the duration an area is kept under fallow. By assessing the length of fallows and available soil moisture, the duration of legume cultivation can be advised, as short cultivation requires less attention and fertigation than conventional crops. This will allow for increased profits and improved food security for farmers.

For harvesting progression and fallows mapping, MODIS daily reflectance, MODIS 8 days composite, MODIS 16 days composite as well as Sentinel-2 satellite imageries were evaluated. All analysis and app development was carried out using Google’s cloud platform for Geospatial analysis, the Google Earth Engine. The satellite-image-based harvesting progression was validated by a conversation with farmers as well as by the ground report of harvesting circulated by the Press Information Bureau in India. The figures of the cultivated area and crop fallows mapping were also found at par with the area presented by the Government of India in the contingency plans.
Environmental Indicators
Nitrogen dioxide is produced from the reaction of oxygen and nitrogen gases in the air. NO2 may be formed by combustion, at high temperatures, and from the industrial sector. Another major cause of air pollution is the combustion of fossil fuels in automotive vehicles that produce nitric oxide (NO) and nitrogen dioxide (NO2). Therefore, the mapping of nitrogen dioxide provides a fair perspective of air pollution. The Sentinel-5P satellite provides NO2 data that was used to monitor air pollution by comparing the pollution levels during Feb- April 2019 with Feb- April 2020. The tool shows a significant decline in pollution levels due to the lockdown from mid-March to April 2020.
Need for More Real-Time Analytics
Disease outbreaks and pandemics severely impact the way we grow, transport, and consume food. COVID-19 has shaken the entire world with a myriad of unprecedented challenges and uncertainties way beyond our imagination and expectations. Such a crisis may become more frequent in our globalized activities, and they need fast and informed responses through a real-time analysis not only to assess situations for site-specific interventions but also systemic monitoring tools that aid research and decision making.
May 11, 2020
cmbiradar